Accounts Receivable Metrics: 2026 Guide To KPIs That Drive Cash Flow & Recovery

Understanding Accounts Receivable Metrics in 2026
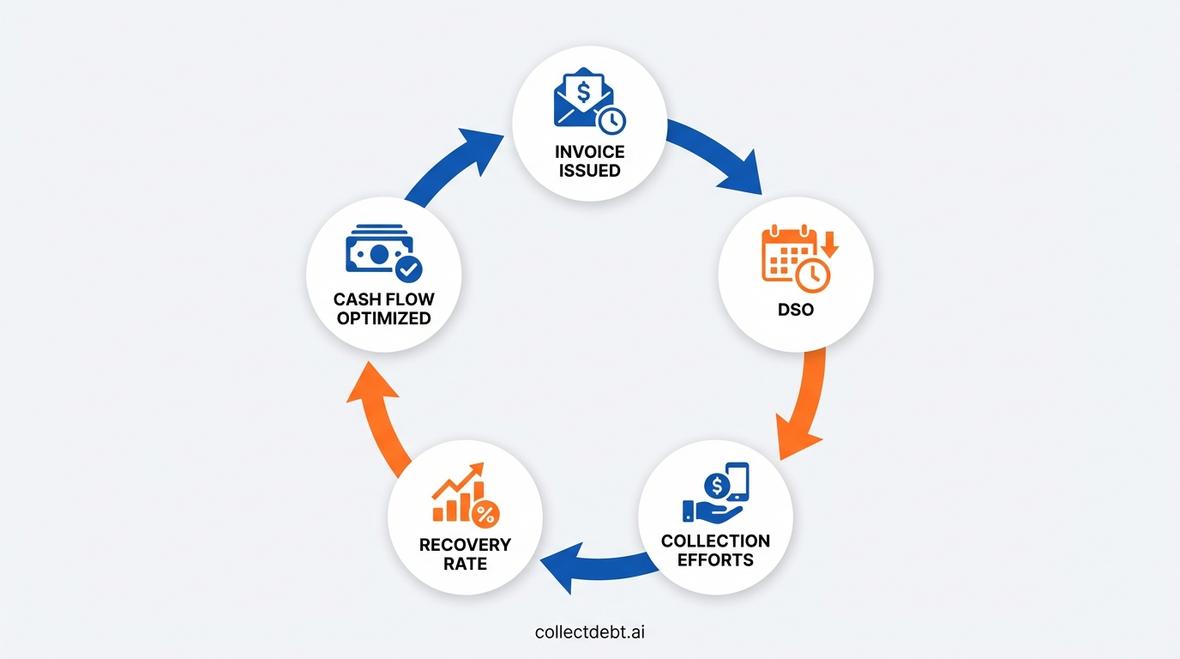
In today's hyper-competitive financial landscape, accounts receivable metrics have evolved from simple performance indicators to strategic tools that drive organizational success. For collections managers, CFOs, and directors of operations, mastering these metrics is no longer optional it's essential for optimizing cash flow, reducing operational costs, and maintaining regulatory compliance.
Accounts receivable metrics provide quantifiable insights into how efficiently your organization converts credit sales into actual cash. These key performance indicators (KPIs) reveal bottlenecks in your collection processes, identify high-risk accounts, and help you make data-driven decisions that directly impact your bottom line. With AI-driven reductions in DSO benchmarks becoming the industry standard, understanding and optimizing these metrics has never been more critical.
This comprehensive guide explores the most important accounts receivable metrics, establishes industry benchmarks, and demonstrates how automation and AI-powered solutions are revolutionizing debt recovery and cash flow optimization in 2026.
Essential Accounts Receivable Metrics Every Organization Must Track
Days Sales Outstanding (DSO)
Days Sales Outstanding represents the average number of days it takes your organization to collect payment after a sale has been made. This metric is arguably the most critical accounts receivable metric for assessing collection efficiency and cash flow health.
The formula for calculating DSO is: DSO = (Accounts Receivable / Total Credit Sales) × Number of Days
According to the A/R days benchmark less than 40 days, organizations should target DSO below 40 days for optimal performance in 2026. A lower DSO indicates faster cash collection and improved liquidity, while a high DSO suggests collection challenges that tie up working capital.
Reducing DSO directly impacts your organization's ability to reinvest in operations, pay suppliers, and maintain financial flexibility. Modern AI debt collection platforms enable companies to achieve meaningful DSO reductions through automated follow-ups, intelligent payment reminders, and predictive analytics that identify at-risk accounts before they become delinquent.
Accounts Receivable Turnover Ratio
The Accounts Receivable Turnover Ratio measures how many times per year your organization collects its average accounts receivable balance. This metric provides insight into the effectiveness of your credit and collection policies.
The calculation is: AR Turnover Ratio = Net Credit Sales / Average Accounts Receivable
Research indicates that the AR Turnover Ratio target 10-12x per year represents best-in-class performance, equivalent to collecting the full receivables balance every 30-36 days. Organizations with turnover ratios under 6x are tying up cash flow for too long and should reassess their collection strategies.
For example, the Accounts Receivable Turnover example of 6.25 demonstrates that with net credit sales of $500,000 and average AR of $80,000, a company achieves a ratio of 6.25. While this indicates some collection efficiency, there is substantial room for improvement to reach the 10-12x benchmark.
Collection Effectiveness Index (CEI)
The Collection Effectiveness Index provides a comprehensive view of how effectively your team collects outstanding receivables during a specific period. Unlike DSO, which can be influenced by sales fluctuations, CEI focuses purely on collection performance.
The formula is: CEI = [(Beginning Receivables + Monthly Credit Sales - Ending Total Receivables) / (Beginning Receivables + Monthly Credit Sales - Ending Current Receivables)] × 100
A CEI score approaching 100% indicates highly efficient collections, while scores below 70% suggest significant inefficiencies. This metric is particularly valuable for evaluating the performance of your collections team and identifying process improvements. Organizations implementing accounts receivable automation typically see CEI improvements of 15-25% within the first year.
Average Days Delinquent (ADD)
Average Days Delinquent measures how long past-due invoices remain outstanding beyond their payment terms. This metric helps you identify chronic late payers and assess the risk profile of your receivables portfolio.
The calculation is: ADD = Sum of (Invoice Amount × Days Past Due) / Total Accounts Receivable
A lower ADD indicates that most receivables are current or only slightly past due, while a high ADD signals serious collection problems. Organizations should aim to keep ADD below 10 days. Implementing promise-to-pay features and automated payment reminders can significantly reduce ADD by engaging debtors before accounts become severely delinquent.
Bad Debt Ratio
The Bad Debt Ratio represents the percentage of receivables that your organization writes off as uncollectible. This metric directly impacts profitability and reflects the quality of your credit approval process and collection efforts.
The formula is: Bad Debt Ratio = (Bad Debt Write-offs / Total Credit Sales) × 100
Industry benchmarks vary by sector, but most organizations should target a bad debt ratio below 2%. Higher ratios indicate either overly lenient credit policies or ineffective collection strategies. Companies with effective accounts receivable management can improve cash flow by up to 25% cash flow improvement with effective AR management, primarily by reducing bad debt and accelerating collections.
Advanced Accounts Receivable Metrics for Strategic Insights
Recovery Rate
Recovery rate measures the percentage of outstanding debt that your organization successfully collects. This metric is particularly important for debt collection agencies and companies with significant delinquent accounts.
The calculation is: Recovery Rate = (Total Amount Collected / Total Amount Outstanding) × 100
Higher recovery rates directly translate to improved revenue and reduced write-offs. Traditional collection methods typically achieve recovery rates between 15-30%, while organizations leveraging AI debt collection recovery rates are seeing improvements of 40-60% through personalized communication strategies, optimal contact timing, and multi-channel engagement.
Cost Per Collection
Cost per collection quantifies how much your organization spends to collect each dollar of accounts receivable. This metric is essential for evaluating the efficiency and profitability of your collection operations.
The formula is: Cost Per Collection = Total Collection Costs / Total Amount Collected
Organizations should strive to minimize this ratio while maintaining compliance and customer relationships. Traditional call center-based collections often have costs ranging from $0.15 to $0.35 per dollar collected. In contrast, end-to-end collection automation can reduce costs to $0.05-$0.12 per dollar collected by eliminating manual processes and leveraging scalable AI technology.
Aging Schedule Analysis
An accounts receivable aging schedule categorizes outstanding invoices by how long they've been unpaid. This metric helps prioritize collection efforts and assess credit risk.
Typical aging buckets include:
- Current (0-30 days): Low risk, standard follow-up
- 31-60 days: Moderate risk, increased contact frequency
- 61-90 days: High risk, intensive collection efforts
- 90+ days: Very high risk, potential legal action or write-off
Organizations should aim for at least 70% of receivables in the current bucket and less than 10% beyond 90 days. Data extraction features in modern AR systems automatically categorize and prioritize accounts based on aging, enabling collections teams to focus resources where they'll have the greatest impact.
2026 Industry Benchmarks for Accounts Receivable Metrics
Understanding how your accounts receivable metrics compare to industry standards is crucial for setting realistic goals and identifying improvement opportunities. Benchmarks vary significantly across industries based on payment terms, customer types, and regulatory environments.
Healthcare Industry: The healthcare sector faces unique AR challenges due to insurance processing and patient responsibility. Best-in-class healthcare organizations maintain DSO below 40 days and collection rates above 95% for insured services. Healthcare-specific AR solutions address these challenges through automated insurance verification, patient payment plans, and regulatory compliance features.
Financial Services: Banks, credit unions, and fintech companies typically target DSO between 20-35 days with AR turnover ratios exceeding 12x annually. The highly regulated nature of financial services requires compliance-focused collection solutions that adhere to FDCPA, TCPA, and other consumer protection regulations while maintaining efficiency.
Retail and E-commerce: Retail organizations with B2B credit programs should aim for DSO under 30 days and bad debt ratios below 1.5%. Retail-optimized AR platforms integrate with point-of-sale systems and e-commerce platforms to automate invoice generation and payment processing.
Utilities and Telecom: These industries typically experience higher delinquency rates due to essential service mandates and disconnection regulations. Target metrics include DSO of 35-45 days and recovery rates above 85%. Utility and telecom collection solutions incorporate payment arrangement features and service restoration workflows.
Leveraging AI to Optimize Accounts Receivable Metrics
Artificial intelligence is fundamentally transforming how organizations manage and optimize their accounts receivable metrics. AI-powered platforms analyze vast amounts of historical data to predict payment behavior, personalize communication strategies, and automate routine collection tasks.
Predictive Analytics
AI algorithms analyze payment patterns, demographic data, and behavioral signals to predict which accounts are likely to become delinquent. This enables proactive intervention before accounts age significantly, improving DSO and reducing bad debt ratios. Organizations implementing predictive analytics typically see 20-30% reductions in delinquency rates.
Intelligent Automation
Modern AR platforms automate the entire collection workflow from initial payment reminders to escalation protocols and payment processing. Batch calling capabilities enable organizations to contact thousands of debtors simultaneously through voice, SMS, and email channels, dramatically improving collection effectiveness while reducing costs.
Personalized Engagement
AI analyzes individual debtor characteristics to determine optimal contact times, preferred communication channels, and messaging that resonates with specific personality types. This personalization significantly improves engagement rates and payment compliance, directly impacting recovery rates and CEI scores.
Omnichannel Integration
Today's debtors expect seamless experiences across multiple communication channels. Omnichannel support platforms integrate voice, SMS, email, chat, and payment portals into a unified system, ensuring consistent messaging while meeting debtors where they prefer to engage. This approach improves contact rates by 40-50% compared to single-channel strategies.
Implementing a Metrics-Driven AR Strategy
Successfully optimizing accounts receivable metrics requires more than just tracking numbers it demands a comprehensive strategy that aligns technology, processes, and people around data-driven goals.
Establish Baseline Metrics
Begin by calculating your current performance across all key accounts receivable metrics. Document DSO, AR turnover ratio, CEI, recovery rate, and cost per collection. This baseline provides the foundation for measuring improvement and setting realistic targets.
Set Specific, Measurable Targets
Based on industry benchmarks and your baseline metrics, establish specific improvement goals. For example: 'Reduce DSO from 52 days to 38 days within 12 months' or 'Improve recovery rate from 28% to 45% by year-end.' Specific targets create accountability and enable progress tracking.
Implement Technology Solutions
Manual collection processes cannot deliver the efficiency needed to achieve world-class metrics. Evaluate best collection software for 2026 based on automation capabilities, compliance features, integration options, and scalability. Prioritize platforms that provide real-time dashboards and customizable reporting.
Optimize Collection Workflows
Map your current collection process and identify bottlenecks, manual touchpoints, and compliance risks. Redesign workflows to leverage automation for routine tasks while empowering human collectors to focus on complex accounts requiring negotiation and relationship management.
Continuous Monitoring and Improvement
Accounts receivable optimization is an ongoing process, not a one-time project. Establish weekly or monthly metric reviews, identify trends and anomalies, and make data-driven adjustments to strategies and tactics. Organizations that embrace continuous improvement typically see year-over-year metric improvements of 15-25%.
Frequently Asked Questions About Accounts Receivable Metrics
What is considered a good DSO?
A DSO below 40 days is considered excellent across most industries in 2026. However, optimal DSO varies by sector healthcare organizations may target 35-45 days, while retail businesses should aim for 25-35 days. The key is comparing your DSO to industry-specific benchmarks and continuously working to reduce it.
How often should I track accounts receivable metrics?
Critical metrics like DSO, AR turnover ratio, and aging schedules should be monitored weekly at minimum, with comprehensive reviews conducted monthly. Recovery rates and collection effectiveness should be assessed daily for active campaigns. Real-time dashboards enable continuous monitoring without manual calculation.
What's the difference between DSO and ADD?
DSO measures the average time to collect all receivables, including current accounts. ADD specifically measures how long past-due invoices remain outstanding beyond their due date. An organization might have acceptable DSO but high ADD, indicating that while overall collections are reasonable, delinquent accounts are aging significantly.
How can AI improve my recovery rate?
AI improves recovery rates through predictive modeling that identifies optimal contact strategies, personalized messaging that resonates with individual debtors, automated follow-up that ensures consistent engagement, and intelligent payment arrangement options that accommodate debtor circumstances. Organizations typically see 40-60% recovery rate improvements within 6-12 months of implementing AI-powered collection platforms.
Which metrics matter most for my organization?
The most important metrics depend on your specific challenges and goals. Organizations focused on cash flow should prioritize DSO and AR turnover ratio. Those dealing with high delinquency rates should emphasize recovery rate and ADD. Companies concerned about profitability should focus on cost per collection and bad debt ratio. A balanced scorecard approach monitoring all key metrics typically delivers the best results.
Conclusion
Accounts receivable metrics provide the quantifiable insights necessary to transform collection operations from cost centers into strategic assets that drive organizational success. By establishing baselines, setting ambitious yet achievable targets, and leveraging AI-powered automation, forward-thinking organizations are achieving DSO reductions of 20-30%, recovery rate improvements of 40-60%, and cost reductions exceeding 50%.
The competitive advantage in 2026 belongs to organizations that embrace data-driven AR management and implement technology solutions that deliver measurable results. Whether you're managing a debt collection agency or leading the AR department of a large enterprise, mastering these metrics and implementing the strategies outlined in this guide will position your organization for sustained financial performance and operational excellence.
Ready to Transform Your Collections Process?
See how CollectDebt.ai can help you automate debt collection, reduce costs, and improve compliance.